Tableau

good-design-award_best-in-class_rgb_blk_logo
  • 2016

  • Digital
    Interface

Designed By:

Commissioned By:

Tableau Software

Designed In:

United States of America

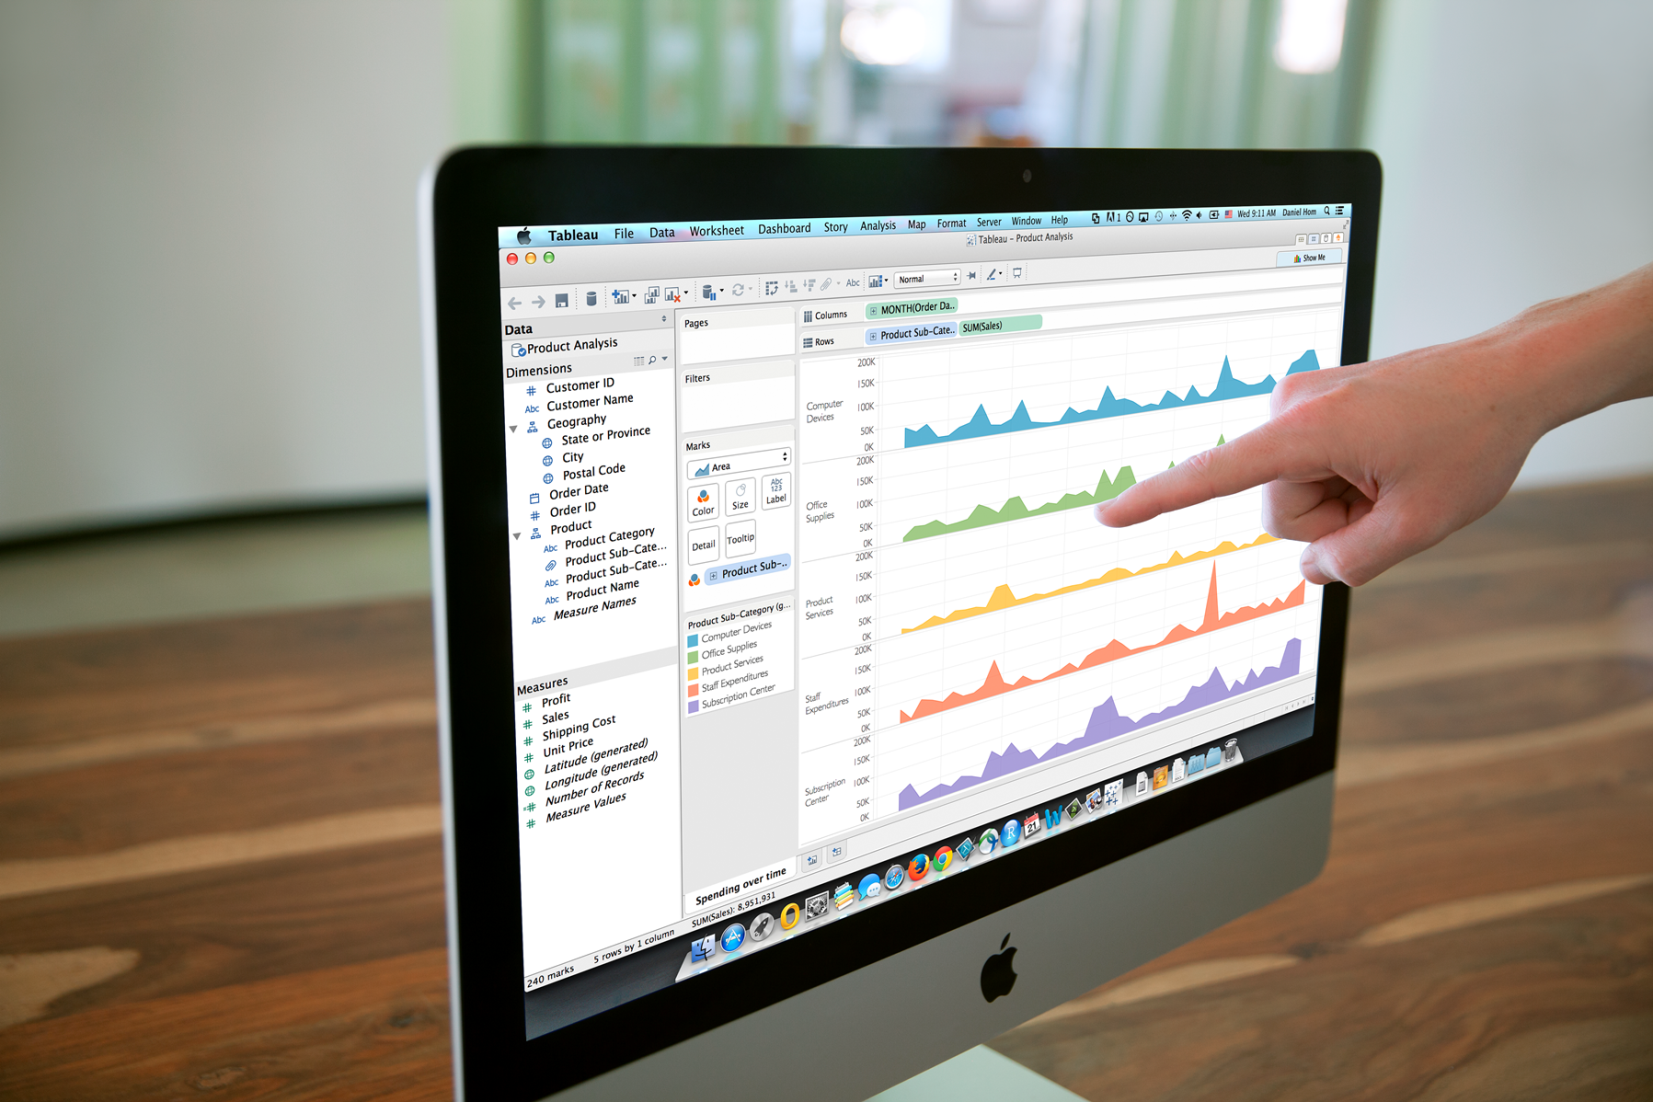
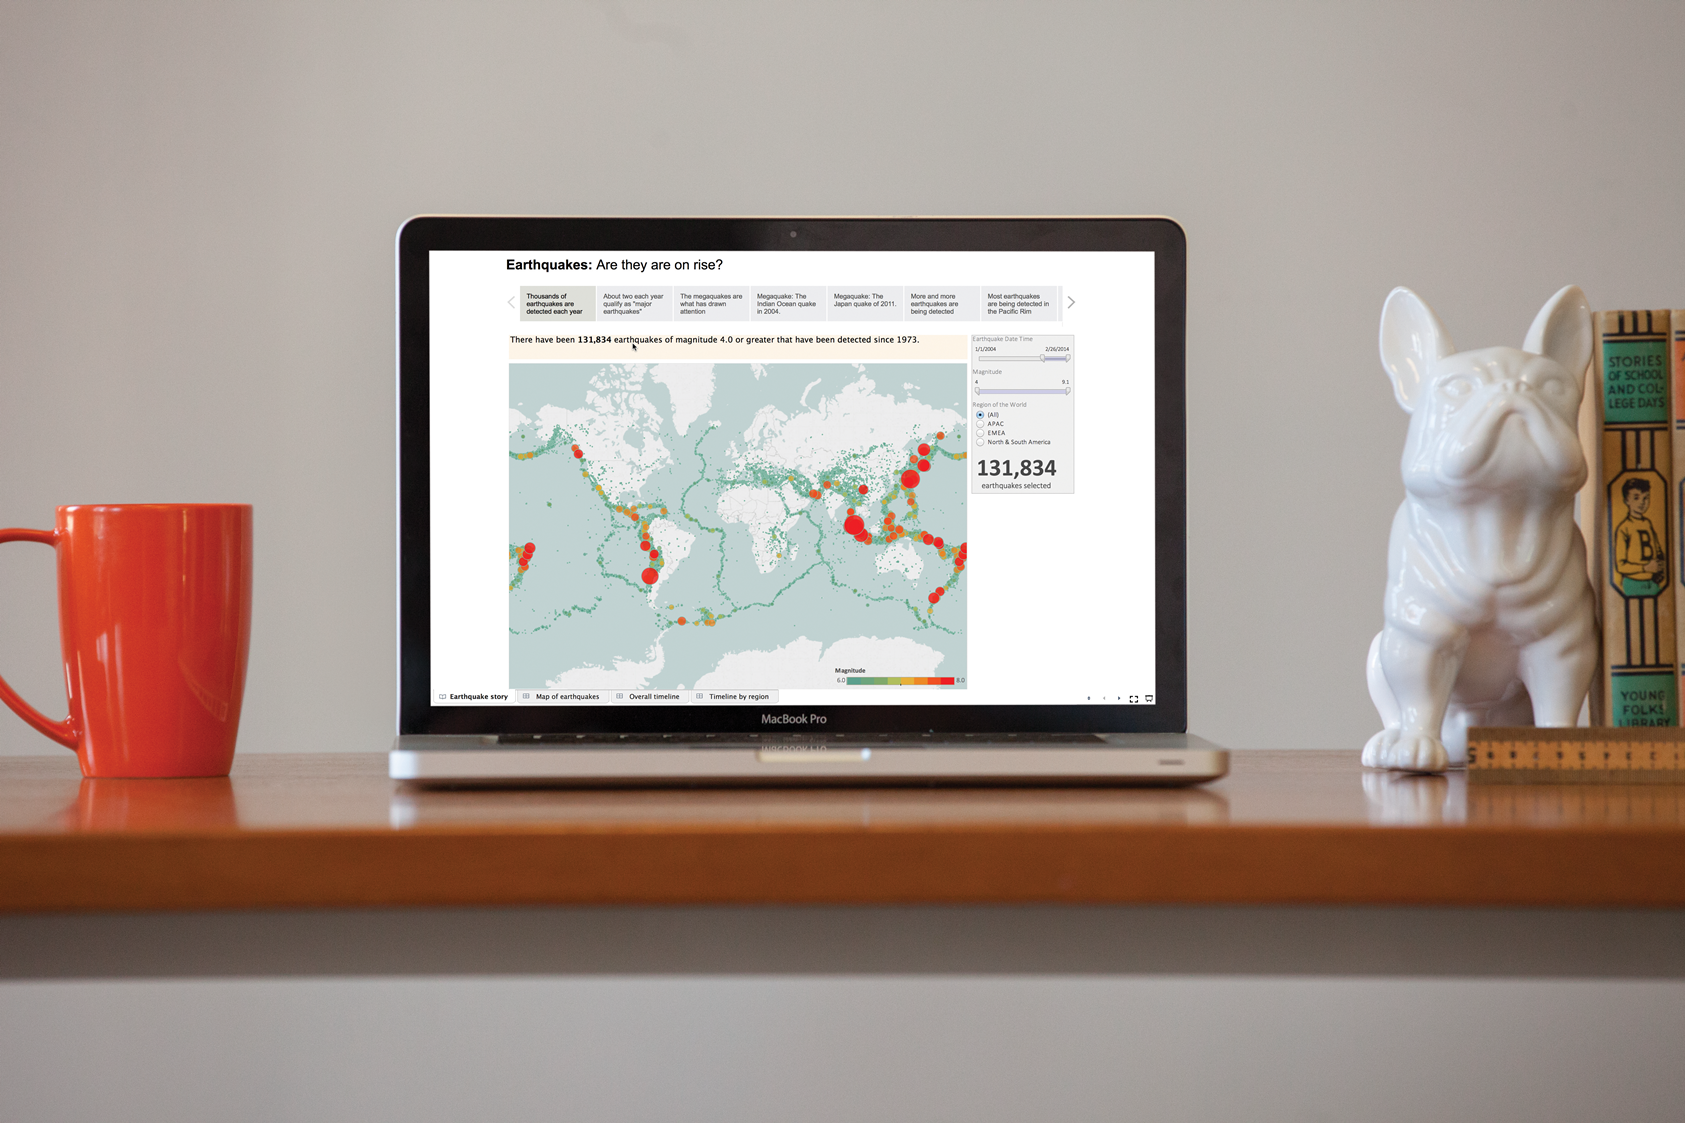
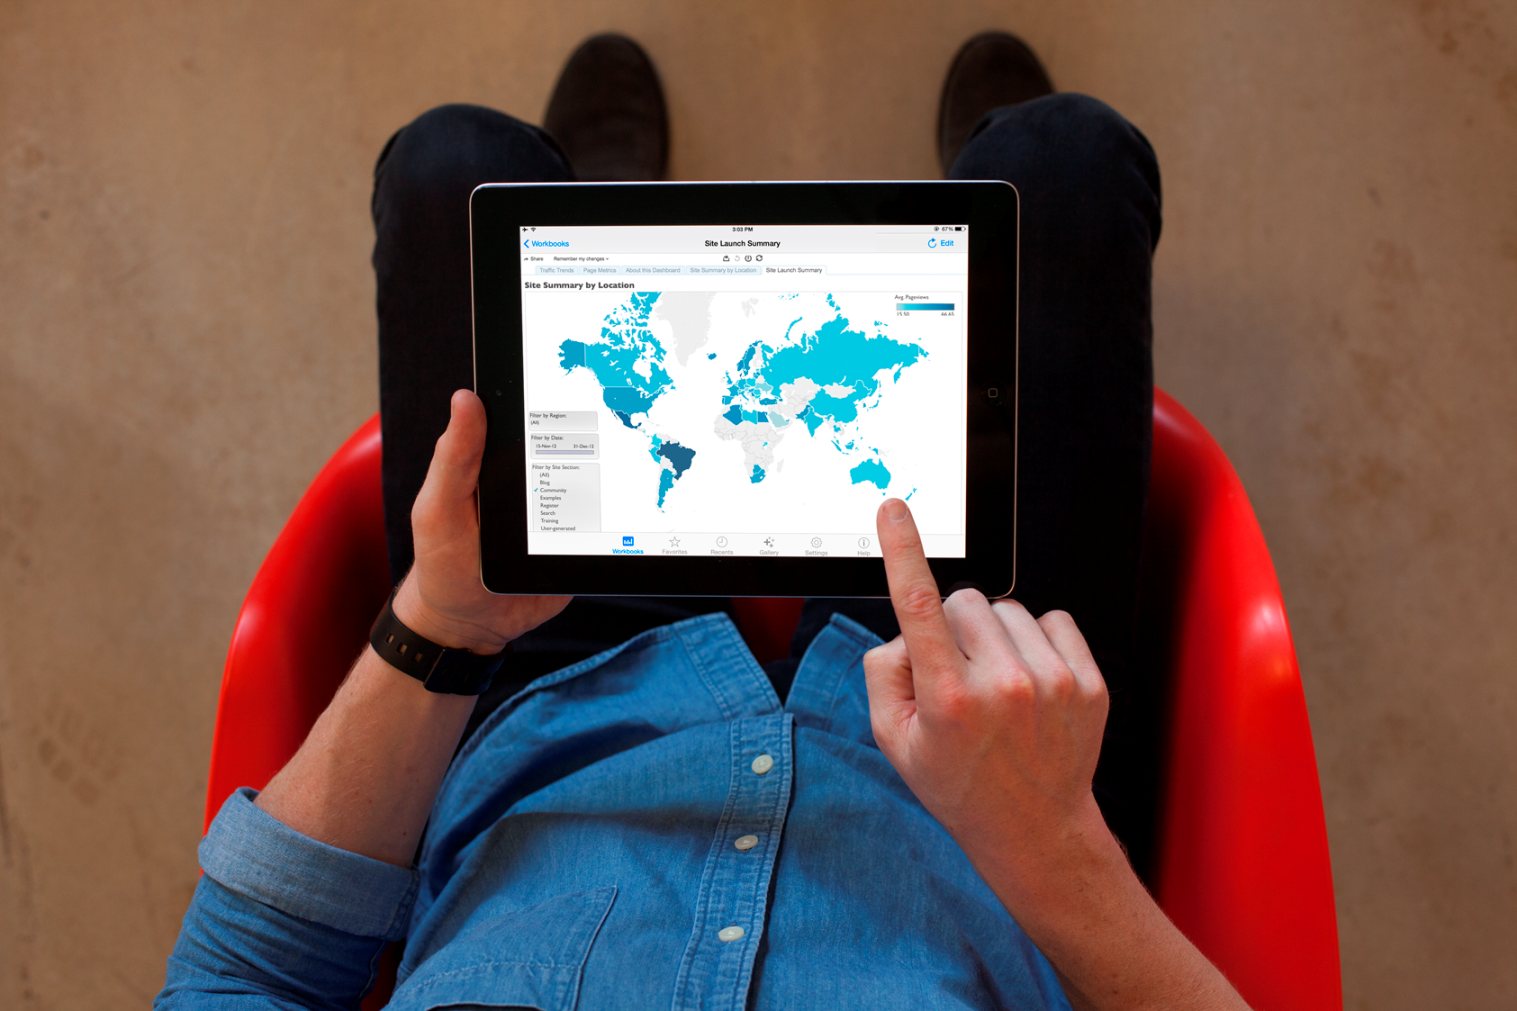
Tableau Desktop is a data visualization product that uses breakthrough technology developed out of Stanford University. Years of research show visual representation of a complex concept makes it easier to understand. This is becoming increasingly relevant in our digital world, where we’re increasingly required to make decisions based on complex data.


view website
view facebook
view twitter

  • CHALLENGE
  • SOLUTION
  • IMPACT
  • In 2003 Tableau spun out of Stanford University with VizQL™, a technology that completely changed working with data by allowing simple drag and drop functions to create sophisticated visualisations. The fundamental innovation is a patented query language that translates complex actions into a database query and then expresses the response graphically. VizQL technology allows users to skip the analytical steps traditionally needed to create a visual representation of data, and simply drag the different data sets which need analysis, to one central place. The software does the rest. As result, the user gains a much deeper understanding of data and can work up to 100x faster than when using conventional methods.

  • The next generation of Business Intelligence (BI) has changed the way we analyse our data. Previously with legacy BI, the process was slow and laborious. Analysers required IT skills such as coding meaning this wasn't a process that anyone could do. Tableau pioneered the next generation, allowing users to query millions of rows of data in a matter of seconds. The beauty of Tableau is that is shows your data in a variety of graphical summaries, from bar and line charts to maps and sophisticated linked views, which activity allows for you to answer question after question. This allows users to find insights that would have been lost should data have been shoehorned into rigid charting templates.

  • Tableau Desktop allows anyone to see and understand data easily. Tableau users are sports teams analysing performance, marketers using the software to showcase the success of their campaign, retailers using a range of variable to predict stock levels, medical professionals asking simple questions about patients and data scientists using complex algorithms and analytics. Complementary programs such as Tableau Public encourage creative exploration of data. To date, more than 150,000 authors have published a total of 470,000 visualisations using Tableau Public. The topics of these vizzes range from trends in pop music, to analysis of world issues such as refugee crisis and world epidemics.